Introducing StorylineJSToday we're excited to release a new tool for storytellers.
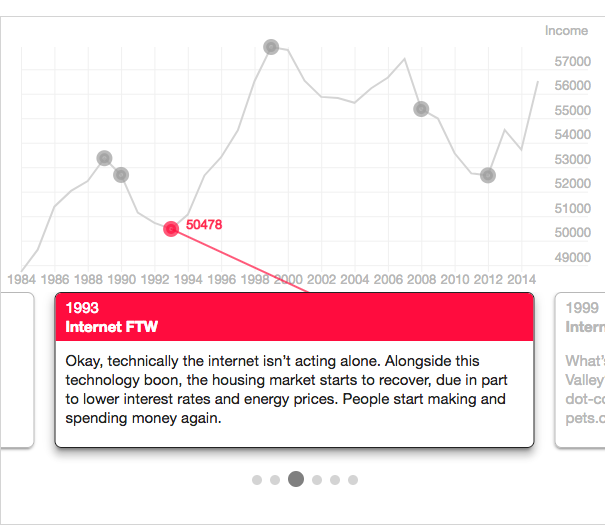
A screenshot of a StorylineJS instance StorylineJS makes it easy to tell the story behind a dataset, without the need for programming or data visualization expertise. Just upload your data to Google Sheets, add two columns, and fill in the story on the rows you want to highlight. Set a few configuration options and you have an annotated chart, ready to embed on your website. (And did we mention, it looks great on phones?) As...