When I joined Knight Lab as a student fellow six months ago, I became determined to make progress on a social network analysis (SNA) tool. As journalists we continually look to provide quality information through captivating perspectives and I believe that network data fulfills a part of that purpose in capturing the details of our society from a structural point of view.
But the fact is that network analysis is a tough problem to tackle. Knight Lab has had an interest in network analysis since at least 2012 and has had a microsite dedicated to the discipline for a year or two. In academia there’s even a phrase — Yet Another Social Network Analysis Tool (YASNAT for short) — that hints at just how difficult the problem is. In 2008, there were more than 60 SNA systems on a list maintained by the International Network for Social Network Analysis, which seems to have stopped tracking since. In this year’s InfoVis conference, there were 22 papers that evaluated user accuracy and speed of completing tasks using data visualizations; six of them dealt with network visualizations.
So to get my bearings before thinking about how to attempt to build a tool, I set out to first learn the history of SNA.
Jacob Moreno and the Birth of SNA
In The Development of Social Network Analysis, Linton C. Freeman, of UC Irvine, writes that Dr. Jacob Levy Moreno is the pioneer of SNA as we know it today, arguing on the basis of his work in the 1930s. There had been previous attempts to incorporate the abstractions of nodes and links to the study of human structures. But as it stood in 1938, Moreno’s work was the sole manifestation of all four features found in modern social network analysis, as laid out by Freeman:
- It was motivated by a structural intuition based on ties linking social actors,
- It was grounded in systematic empirical data,
- It was heavily on graphic imagery, and
- It relied on the use of mathematical and/or computational models.
Now, Dr. Moreno is one interesting dude. He had a medical degree, but he also had an over-the-top passion for telling stories. In his 1985 autobiography, he recalls a story of his birth on a ship on the 400th anniversary of the Expulsion of Jews from Spain. He also writes that, having "played God" throughout his life, he once formed a new religion as a student at the University of Vienna, believing that he "was on the planet to fulfill an extraordinary mission."
In the 1920s, he published The Theatre of Spontaneity, in which he began to develop the philosophies behind psychodrama and sociodrama. The two methods of psychotherapy involved role-playing in various theatrical settings, and Moreno believed that patterns of interactions among the patient-actors where spontaneity is crucial could provide insights practical to their everyday lives.
In that book, he provided his first network diagrams, used to map actors and their interactions in scenes. Today, the most accessible topics in network analysis still involve the performing arts. The co-occurrence network of characters in the play Les Miserables is used as the primary example of structural data in the network analysis platform Gephi, as it also is in D3, the JavaScript data visualization library, and in Sigma.js, a graph drawing library. Similar co-occurrence networks for more than 700 movies have been visualized at moviegalaxies.com. IMDb is a source for many different forms of network data, from the collaboration network of actors (where two actors have a link if they starred in a movie together) to the reference network of movies (where two movies have a directed link if one makes a reference to the other). "Six Degrees of Kevin Bacon" is a popular game that challenges one to find, in the collaboration network, a path between an actor and Kevin Bacon with the shortest length. An online version is available at The Oracle of Bacon website.
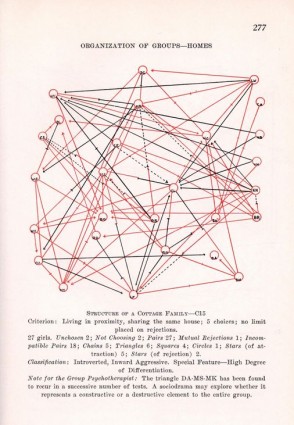
From 1932 to 1934, at the Sing Sing prison in Ossining and the New York State Training School for Girls in Hudson, Moreno conducted studies to research group behavior, with methodological questionnaires he termed "sociometric tests." With his network diagrams and accompanying explanations, Moreno showed that the recent epidemic of runaways from the Hudson school could be explained through ties of attraction and repulsion that linked together and forced out those who had left. A 1933 article in The New York Times, titled Emotions Mapped By New Geography, covered his work at the school, showing that the study of networks has been of interest to journalists since its very beginning.
In his 1938 paper Statistics of Social Configurations, Moreno published a mathematical model of the tendency of individuals to link themselves to others non-uniformly. Famously in 1999, Albert-Laszlo Barabasi and Reka Albert independently modeled this process again, showing that the preference for attachment to highly connected actors leads to the emergence of a scale-free network, where the distribution of the number of connections each person has follows a power law, and thus few people have a lot of connections while a lot of people have few connections.
Journalistic uses of social structures
We’ve collected nine journalistic pieces that examine social structures and explain them with visualizations. I find that although most of them use systematic and empirical data, none of them utilizes mathematical methods.
| Title | Published on |
| The Stem Cell Wars | New Scientist |
| Calderon Family Connections | Los Angeles Times |
| Galleon's Web | Wall Street Journal |
| Flip Investigation | Saratosa Herald-Tribune |
| Web of Influence | Dallas Morning News |
| Conversation About Guns on Twitter | The Atlantic |
| A Web of GOP Influence | NPR |
| Wen Family Empire | New York Times |
| Clubs That Connect the World Cup | New York Times |
I have found such examples to be very useful in guiding myself through the terrain of social networks research. If you have run into any others, please tweet them at me @AllGoneMattHong.
Next steps
As I began to define the intersection of journalism and SNA in more organized terms, I found that deriving relationship strengths, important players, and patterns in network data might be putting the cart before the horse. What journalists need is a more efficient way to collect data and a better diagram to accompany it. To that end, Al Johri, Anne Li, and I will be chipping away at a tool we believe will assist in the creation of better visual stories with social network data. I’ll be writing a series of articles in order to share our research and development with the wider journalism community. My goal is to provide a solid scientific context for whatever we end up building and a narrow definition of what it is, what it isn’t, and where it fits in in the paradigm of SNA.
If you have an interest in networks or data stories, stay tuned for more.
About the author