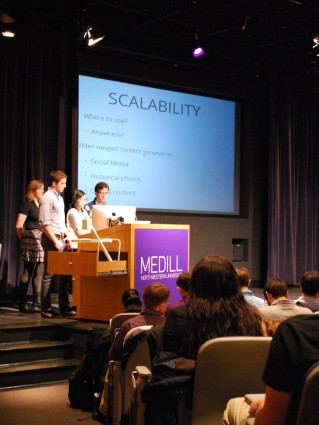
Yesterday, 30 journalism and computer science students in Northwestern’s Collaborative Innovation in Journalism and Technology class presented nine new media prototypes. The prototypes, developed in a 10-week quarter, cater to various audiences in the media equation — “tools for journalists, software for publishers, and applications that could be useful or fun for media consumers.” Occasionally, promising prototypes will be further developed by Knight Lab.
If you missed the presentation, a summary of the apps and a note on what the teams have identified as their next steps, lies below. If you’d rather watch the archived live stream, that’s available here.

Spectacle (Ellie Burgess, Ina Yang, Alex Hollenbeck, Matt Hlavacek):
“Everyone sees the world with a different perspective,” this team said to open their presentation. Their Google Glass app aims to consolidate those perspectives as best as possible with an augmented reality that provides three different options to interact with locations on Northwestern’s campus:
- viewing the official description, official photos, and historical information about the location
- viewing the location’s social description - Foursquare checkins, Instagram posts, and their accompanying comments
- leaving a Footprint of one’s own by responding to prompts (“What was the funniest thing that has happened to you in Norris University Center?”), to contribute to the “social history” of the location. The name Footprint, the team noted on the class blog Tech Media Street, refers to the saying, “Take nothing but pictures; leave nothing but footprints” - both of which you can do with Spectacle.
Key next steps: A push for ‘wider-ranged content generation’ via more social media channels, historical photos, and official content.
Baby Steps (Anthony Settipani, Zack Witten, Matt Hong, Jhanai Dhakshamoorthy):
This toolkit was built to provide client companies with detailed information about trending topics within their target audience. In the prototype case, the team built Baby Steps to help Pathways.org, a non-profit pediatric healthcare organization, better connect with parents and healthcare professionals. Baby Steps culls data from Twitter to find the hashtags currently most correlated with being a parent or healthcare professional. They also pull data from popular forums like BabyCenter to find topics parents are interested in - and the context in which they’re interested in them. The information would then be delivered to Pathways.org via email newsletter.
Key next steps: Among other things, automating email delivery and developing a web app that would provide real-time streaming of popular hashtags and posts within the target audience.
TwConnect (Cameron Johnson, Zhenyu Zhang, Garima Jain):
Pitched as a tool to help people connect - say, to better form a business relationship, or to hit it off on a first date - this web app compares the tweet histories of Twitter users in order to find connections between them and provide common topics of interest. An entertaining live demo comparing @actuallynph and @joshradnor (both actors from the CBS sitcom How I Met Your Mother) returned:
- A Tweets tab displaying a word cloud showing the most common hashtags and keywords they both tweeted, and a histogram comparing the frequency of their tweets in categories like sports, politics, and entertainment.
- A People tab showing users they were both following and their common mentions.
- A Media tab, with slideshows of each users’ tweeted photos.
Key next steps: Sentiment analysis on whether each user’s discussion of a topic is favorable or not, and a wider reach for the Media tab to let it display users’ Instagrams, videos, and Vines.
Buzz (Jason Cohn, Amanda Anumba, Alice Zhang):
This “data exploration” app, inspired by Knight Lab’s Neighborhood Buzz, pulls geolocated tweets to determine which pop culture topics are trending in specific cities. There are two main functions:
- discovering the trends
- comparing them across cities (e.g. what is trending in Los Angeles that’s also trending in Chicago?)
To identify pop culture references, Buzz gathers keywords from websites like Billboard.com and Wikipedia before searching for them on Twitter. The Discover page, in addition to having a pretty interface featuring each city’s skyline, allows users to view relevant Youtube videos, news articles, and recent tweets and images based on the trending topic they click.
Key next steps: Harvest a wider range of pop culture keywords (from sources specific to sports, TV, books, etc.) and be able to narrow down trending topics by genre, in addition to city.
TweetBeat (Megha Singh Das, Philip House, Denise Lu):
This team built on an issue we’re all too aware of: that Twitter can be a fantastic source of information and breaking news, but that it’s impeded by far too much noise. Built to allow journalists to keep a closer eye on their beats, TweetBeat was inspired by both Tweetdeck and the Knight Lab’s TwXplorer. When given up to five Twitter handles, TweetBeat displays a larger network of similarly relevant users; returns their most commonly shared keywords, hashtags, and links; and provides a list of central users with information on the percentage of the network that follows each of those users.
Key next steps: Allowing users to add more handles and specific time frames for their searches.
Datatrack Chicago (Amon Jones, Michael McCarthy, Thomas Saxton):
Also built for journalists (particularly those looking for stories within data), Datatrack provides users with statistical analysis highlighting recent and long-term trends as well as any records set within data from the City of Chicago Data Portal. The team’s live demo analyzed a spreadsheet on CTA ridership over the past 20 years. Critically, the first thing at the top of the results page was not a complex data table, but instead, easy-to-read trend observations made by the program. As the team noted on Tech Media Street, the results “highlight recent statistics, long-term trends, and notable patterns from year to year” on bus and rail ridership specifically, as well as total ridership.
Key next steps: To better identify what qualifies as a “good observation” for the top of the results page to return only truly relevant and significant information, and to expand analysis from strictly yearly time periods to monthly or weekly time periods as well.
Cinecast (Joseph Diebold, Jordan Geltner, Dane Stier):
Cinecast’s key function is its ability to predict the box office revenues for upcoming movies. The team analyzed box office meta data to determine several factors of a movie’s success and failure, including the current competition, the popularity of the actors, any prequel success, and whether or not the movie is based on a book. The app also provides information on how much influence each factor had on a movie’s success or projected success. Though Cinecast was created for journalists looking to analyze box office revenues, the team also hopes casual movie-goers and film critics will find the information useful.
Key next steps: An improved interface, and the integration of social media buzz as a factor in box office success.
Newstube (Antonia Cereijido, Tom Chen, Jessica Gaddis, Eric Jizba):
Billed as a “better news video search”, Newstube doesn’t rank some YouTube channels as better than others, but instead categorizes them so users can easily find the sources they’re looking for. The team’s cleanly designed website features four tabs with YouTube videos from prominent international news services, local TV news stations (searchable by zip code), documentary filmmakers, advocacy groups. A fifth tab highlights related videos trending on Twitter.
Key next steps: Crowdsource the database of local TV news stations, their corresponding zipcodes, and their corresponding Youtube channels (currently maintained by the team), to allow users to add and rate those channels. Alternatively, create a web crawl that can automatically pull lists of those channels from sites like Wikipedia.
OpShop: Congressional Voice Box (Kelly Gonsalves, Salil Gupta, Alex Sanz):
This webapp takes on the ambitious task of reducing political polarization by providing information on multiple viewpoints of an issue. Users enter the URL of any news article, and OpShop returns quotes on the topic from four members of Congress with different political positions (extremely liberal, moderately liberal, moderately conservative, and extremely conservative.) The quotes are displayed along with the headlines and links to the articles they were pulled from. The app was developed with Bing Search API, and like many other team’s apps, the natural language processor AlchemyAPI.
Key next steps: A more targeted selection of public figures (the members of Congress are currently randomly selected), and an analysis of dimensions beyond liberal vs. conservative.
About the author


