Some students take it easy for the spring semester of their senior year; I loaded up on Introduction to Algorithms and Statistical Methods for Data Mining. The stats class covered theoretical foundations for data mining techniques like logistic regression and neural networks and finished with an open-ended group project assignment.
As it happened, the class coincided with Chicago Public Schools' decision to close 49 schools. The move drew ferocious criticism from community groups (including the Chicago Teachers Union), which claimed CPS unfairly selected the schools to be closed. Protesters and internet memes accused the district of racism.
Those accusations turned out to be the perfect fact checking project for my algorithms and stats class. Classmates Jim Garrison, Jaya Sah and I used three data mining techniques — logistic regression, neural networks and classification trees — to determine if racial demographics predicted schools closings.
Feel free to read our 15-page report or look at the slides from our in-class presentation, but if you don't have that time, read on for five data observations I made during the project.
1) Get the basics
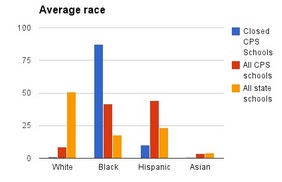
Before we opened SPSS to apply our data mining methods to determine if race is a predictor for schools closings, we ran some basic averages to get an initial evaluation of the protesters’ claims. Indeed, the Chicago school closures disproportionately affect black students, who make up 40% of the Chicago student population but 90% of the student body in closed schools.
2) CSVkit rules
Thanks to Joe I could use a schema to convert the 225 megabyte, semicolon-delimited 2012 report card file to a CSV. SPSS still couldn’t import 9,655 data attributes at once, and understanding what was in the dataset was a struggle.
CSVkit was a godsend. Chris Groskopf’s tool allowed us to examine and splice the data just how we wanted before importing it to SPSS. (More on our data cleaning methods below.) CSVkit allowed us a smooth workflow testing CSVs with different attributes so we only stayed in the library until 2 a.m., not 5 a.m.
Slicing 9,655 Illinois schools columns. All praises to csvkit. pic.twitter.com/4DCD2VgYSC
— Dan Hill (@DanHillReports) May 28, 2013
3) Have a dirty data plan

Being aware of and dealing with “dirty data” – information that is inaccurate or incomplete – is vital for any data-driven project, but it was especially crucial to our data mining techniques. Neural networks and logistic regression fail with missing data, so we had to clean our dataset.
We observed that the report cards included fields for high school graduation and high school test scores, even though the majority of our closed schools were elementary schools for which those did not apply. We used CSVkit to exclude those fields. For other missing data fields, however, we also could have used SPSS processes that compute averages to assign to missing data fields.
4) Another dimension, another dimension
The thousands of data attributes for each school also posed a challenge for SPSS and prevented our data mining methods from drawing conclusions. The case of having lots of columns in your CSV is called “high-dimensional data,” and it's an increasingly common situation in our data-driven world. Although techniques like “feature screening” and “multi-dimensional scaling” algorithmically address this issue, we came up with our own approach. We called it “the bracket,” or “March Madness.” Read our report if you’re curious.
5. Consider the source
Wrangling the state dataset was one of the most difficult aspects of this data mining project, so we could have considered using other sources or mashing several. A few possibilities for our project, which use various data sources and employ different levels of data analysis:
So what, finally, did logistic regressions, neural networks and classification trees say about the CPS school closures?
Our tests largely found attendance rate – “the aggregate days of student attendance, divided by the sum of the aggregate days of student attendance and aggregate days of student absence” – to be the best at predicting whether a school would close.
This supports CPS claims that schools were closed based on its own utilization metric. However, as Ramsin Canon writes, just because a decision isn’t based on race doesn’t necessarily mean its effects aren’t discriminatory.


