When I started using software to analyze data as a reporter in the late 1980s, "data journalism" ended once my stories were published in the newspaper.
Now the publication of the story is just the beginning. The same data can also be turned into compelling visualizations and into news applications that people can use long after the story is published. So data journalism — which was mostly a one-person job when I started doing it — is now a team sport.
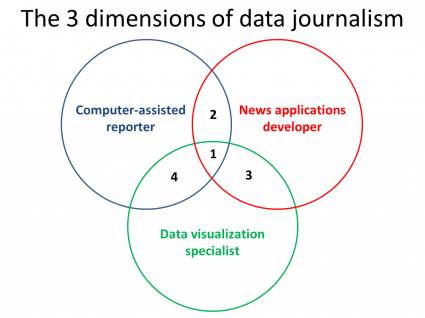
So if you're running a news organization that wants to start doing data journalism, how should you proceed? At the American Society of News Editors conference last week in Washington, I argued that news leaders need to think about three dimensions of data journalism -- and three different types of journalism skills. Here's the graphic I showed them:
The point of the diagram is that to do data journalism well, a news organization needs to employ people with three discrete sets of skills. The numbered areas on the graphic represent people or jobs that blend more than one of these skills, and it's certainly great when a news organization can find someone who can do more than one thing well. But typically, the skills involved in data journalism will be found in at least three different people.
Here's what I think are the three dimensions of data journalism:
- Computer-assisted reporter: These journalists typically start as news reporters and develop expertise in obtaining, analyzing and finding newsworthy angles in data. (When this discipline emerged in the late 1980s, journalists called it "computer-assisted reporting," a term that is still commonly used.) These journalists have a "data state of mind" for reporting and know how to query (or interview) data to discover the most interesting and relevant findings. They typically use spreadsheets, database and mapping software, but many are now also acquiring programming skills so they can simplify some of their work -- for instance, writing scrapers that pull down data from websites that don't offer API's or data downloads.
- News applications developer: These are the newest data journalists to arrive in newsrooms, either moving from careers in computer programming or learning programming skills as part of their journalistic work. Their job is to figure out how best to make data available to users online. They have hands-on skills in back-end programming, database configuration and administration, as well as HTML, CSS and JavaScript so they can build the interface to their applications.
- Data visualization specialist: Historically news organizations had graphic artists whose job was to create static graphics that illustrated data-driven (and other) stories. As graphic artists did when they created static graphics, data visualization specialists understand how to present data in interesting and accessible ways, and they understand the principles of good information design. But since graphics on the Web can be clickable and interactive, these journalists increasingly do front-end programming and make use of open-source Javascript libraries such as D3.
All of these disciplines have historic roots in news organizations. The computer-assisted reporter worked on the city desk, the news applications developer was probably a programmer for the company's business operations, and the data visualization specialist was a graphic artist. As their jobs have evolved, though, they all increasingly need programming skills.
News organizations seeking to fill these roles are finding it difficult. Quite simply, there is more demand for people with these skills -- both inside and outside of journalism -- than there are people qualified to fill them. At the ASNE panel, "Data Journalism: The Myths and the Magic," I argued that news organizations need to take a long-term view and "grow your own talent." This means identifying current staff members with potential to develop these skills and recruiting promising college students who can build their skills as interns or part-time employees.
Among current staff members, potential computer-assisted reporters can be identified by their use of spreadsheet or database software in their work, their comfort with math and data, and the way they use numbers effectively in their stories. Potential news applications developers might be working in a news organization's IT department, but can be identified by their interest in journalism, their participation in "open government" initiatives and their use of contemporary programing languages such as Ruby and Python. And potential data visualization specialists can be identified by their interest in working on data-intensive graphics, their comfort with math and data and possibly some prior experience with mapping applications or JavaScript.
The kind of people who do data journalism are, of course, the core audience for the Knight Lab blog. Do you see yourself in this graphic? Are you a computer-assisted reporter, a news applications developer or a data visualization specialist? Or maybe you fit into one of the numbered areas where these skill sets overlap? Let us know in the comments below — or on Twitter mentioning @knightlab and the hashtag "#datadimensions."
About the author
