How many of you have tried to diet before?
I know I have my fair share of attempts.
So we all know there are better and worse foods for you (say, vegetables over macarons). The same logic applies to information. We live in a world of information overload, and consuming more of this information doesn’t necessarily make us smarter. In fact, it can do the opposite.
People need to be more conscious about the information they’re consuming. Because it’s really easy to go through life passively consuming information without really getting any smarter. In order to really hone and develop critical thinking skills, we all need to be aware of the kinds of information we’re putting into our body.
As it happens, we built an app for that.
This past quarter, I took a class titled “Collaborative Innovation and Journalism in Technology,” a practicum-type multidisciplinary class that puts programmers and journalists on projects for the duration of the quarter. It’s co-taught by two Knight Lab faculty members, Larry Birnbaum and Rich Gordon.
My team (Basil Huang, Gursimran Singh and Amelia Kaufman) was assigned a project based upon an idea originally sketched by a team that included the Lab's Joe Germuska and Larry Birnbaum at last year's MozFest election-hacking session, which was inspired on Clay Johnson’s book, “The Information Diet: A Case for Conscious Consumption.”
“The world of food consumption and the world of information consumption aren’t that far apart: Both the fields of cognitive psychology and neuroscience show us that information can have physiological effects on our bodies, as well as fairly severe and uncontrollable consequences on our decision-making capability.”
The problem of information intake is a really interesting one. There are many things to measure when it comes to reading online, and how to utilize these metrics to quantify engagement.
In brainstorming the interactions of our system, we kept circling back to some main thoughts.
First, diversity of news sources. Sure, you read entertainment and tech and business and politics, but are you always going to the same sources for your news in these categories?
Second, reading level. Hopefully it’s above that of a fifth-grader. Are you only reading short tweets? Two hundred-word blurbs from Buzzfeed?
Third, news categories. This one was pretty obvious, but providing a breakdown for users of the topical categories for the content they’re reading online.
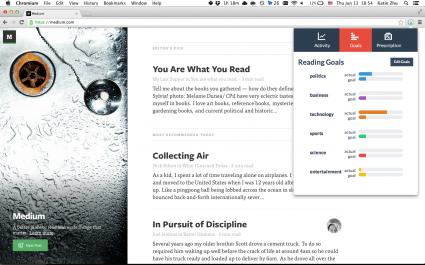
We also wanted to provide Mint-like functionality to allow users to customize these measures and set goals for themselves. Let’s say I don’t really care about sports, but I don’t want that preference to negatively count against me.
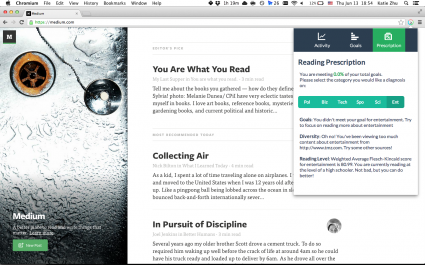
Another important feature we decided on was prescription. Sure, we can display a bunch of pretty charts to help visually quantify a user’s information intake, and aggregate the top news sources per category. But in order to provide more utility for our users, we wanted to build some sort of recommendation system, one that takes into account both a user’s reading habits (based on what we’re tracking), as well as the user’s predefined goals.
We built a Chrome extension to help users read better and smarter.
It does three things, primarily:
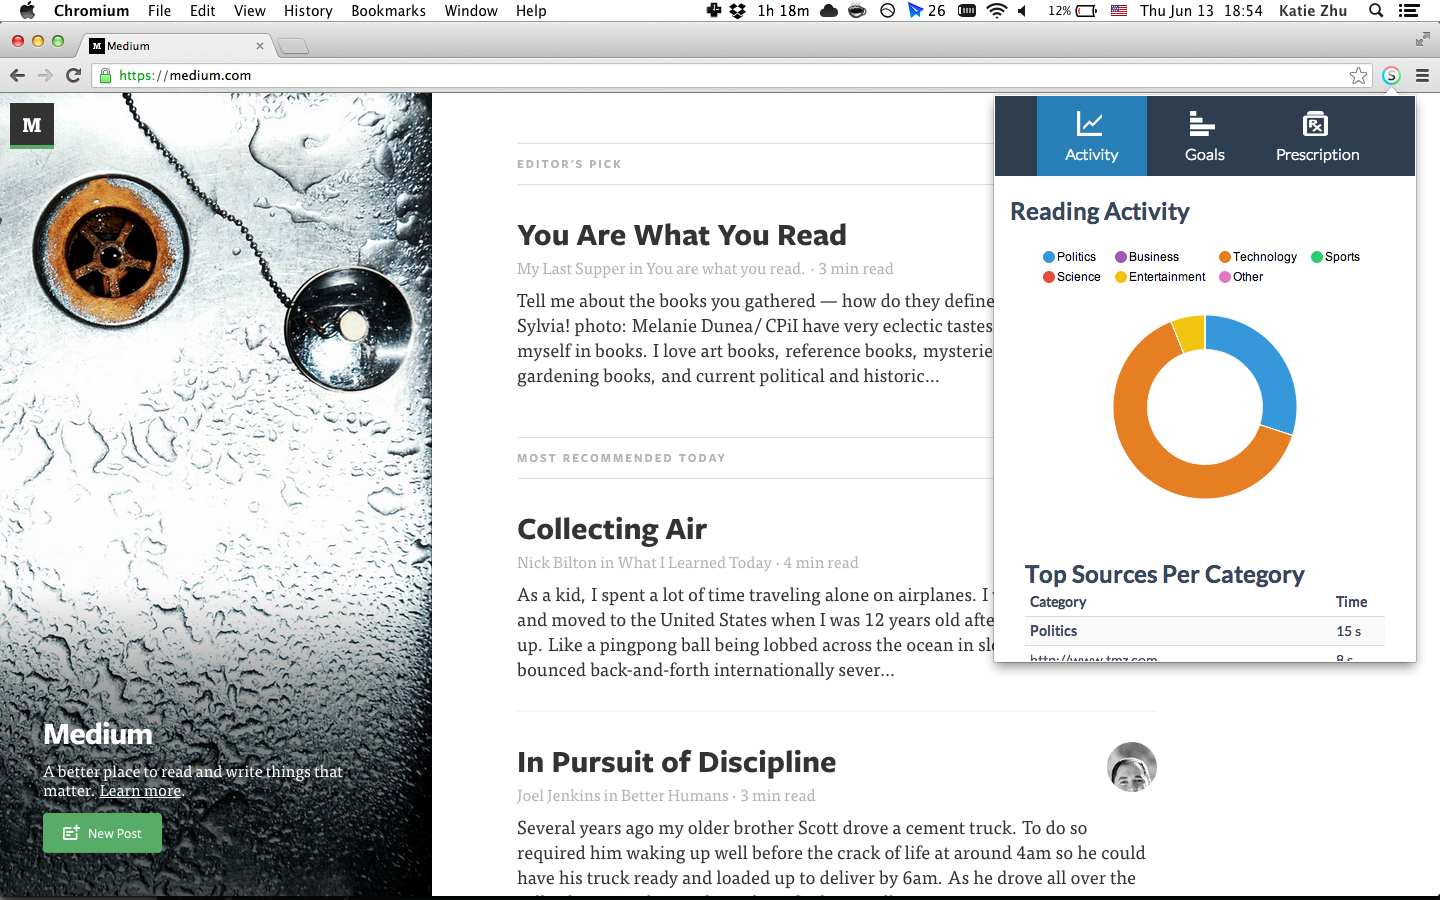
- It automatically tracks a user’s reading activity, visually displaying this information and calculating the top site of news consumption per category.
- It allows users to set goals for their reading activity to help them change their habits.
- It recommends action items for users to change their reading habits based on their predefined goals and reading activity.
After installing the extension, it runs run in the background and monitors the user’s browsing activity.
So let’s say I navigate to a Buzzfeed article. Our system extracts the page content and URL, runs this through a categorizer and calculates the reading score of the article. We then store this page information and analysis in the browser’s local storage (meaning it’s all on the client – so it’s fast and private). I can then interact with this data in the extension’s popup, where we display a visual analysis of the numbers and provide direction and recommendations for how to improve.
The alpha version is available here. Try it out! We’d love to hear your thoughts and feedback, which you can send here: knightlab@northwestern.edu.
About the author