Natural Language Processing is still very nascent within the field of journalism. Apart from a few great examples, the world of NLP has barely been tapped by news organizations. This year at Mozfest, I facilitated a session "How to find insight hidden in speeches, scripts and books with computers."
In the days leading up to my session, I spent hours wrangling various datasets in hopes to create The Perfect Lesson Plan ™ complete with a PowerPoint presentation – exactly the opposite of what an unconference needs. I prepared ipython notebooks for the congressional record, emails from the DNC and RNC, and a large database of movie subtitles.
You’ll be glad to know that I used a resounding 0% of it.
The session began with a rocky start as I missed the first ten minutes – it turns out transferring the entire congressional record on to flash drives takes much, much longer than an hour. Thankfully Dan Schultz, a designated “super facilitator”, swooped in to save the day. We went around the room introducing ourselves and I grew nervous by the second realizing I was an undergraduate college student about to speak in the presence of some of the biggest news nerds in the industry.
Eager to get started, we began talking at a high level about NLP and its various uses such as summarization, translation, entity recognition, and part of speech tagging. Without my overscheduled lesson plan, the conversation flowed smoothly as people talked about their individual experiences or pitfalls with NLP.
As we discussed various projects, some of the basic concepts of NLP began to naturally emerge. Here are some highlights:
Vectorizing Documents
One of the most central concepts to all of natural language processing is the idea of vectorizing a document. To those more familiar with the field, it’s often glossed over as the obvious first step; but taking a step back, it isn’t entirely intuitive how to take some qualitative data and begin performing a quantitative analysis. One of the most common methods of vectorizing a document is TF-IDF. At a high level, TF-IDF is a way to tell how important a word is to a document within a set of documents (referred to as a corpus).
To break it down, TF-IDF is two acronyms combined - TF, term frequency, and IDF, inverse document frequency. Although there are multiple ways of computing both statistics, to simplify, TF is just a count of the number of times each unique word appears in the document forming a one dimensional array. IDF is found by dividing the total number of documents by the number of documents containing a particular word. The point of IDF is to weigh the TF by how common a word is within the corpus. A common word will have a very low IDF. For example words like “a” and “the” usually have an IDF close to 1 as they are in every document. The product of these two statistics is the TF-IDF.
TF-IDF results in a 2 dimensional matrix where the rows represent each document and the columns are individual words.
Reducing Dimensionality
Another important tool when performing natural language processing is reducing dimensionality. After you’ve converted your corpus into one large matrix, you often want to take your dataset and plot it onto a chart to see how similar or dissimilar your text is. This also helps find any outliers with significantly different rhetoric from the rest of your data.
The algorithm we talked about specifically is called LSA, or Latent Semantic Analysis. If you’re coming from a different field you may be familiar with PCA (covered by Chase Davis in NICAR 2013 Lightning Talks). Both PCA and LSA are based on a linear algebra concept called Singular Value Decomposition. Without getting too technical, LSA is used to find the underlying meaning or “concepts” behind documents. If each word only means one concept, and each concept can only be described by one word, LSA is very simple. However, obviously this is not the case. Words have synonyms and words can have multiple meanings. When trying to plot documents in 2 dimensions, we want to compare the distance between the “meaning” of documents as opposed to just the words. This is what makes LSA such an important tool.
Clustering
After reducing dimensionality, a clustering algorithm (example1, example2) is often employed. Clustering at a high level is a means to break a set of datapoints into smaller groups based on how similar or different they are. One example of a clustering algorithm is k-means clustering.. K-means starts with n datapoints and a value of k for the number of clusters the data will break up into and can be described in 3 steps. First, in order to find the clusters, k-means chooses k random points in the feature space around which data will cluster. Second, based on the distance from each cluster center (or centroid), datapoints are assigned to a cluster. Last, taking the mean value of all coordinates within a cluster, new centroids are formed. The last two steps are repeated until the distance the centroids move between step 2 and 3 is negligible. This algorithm, also covered by Chase Davis, is especially useful at finding similar items, or in this context, similar documents.
Classification
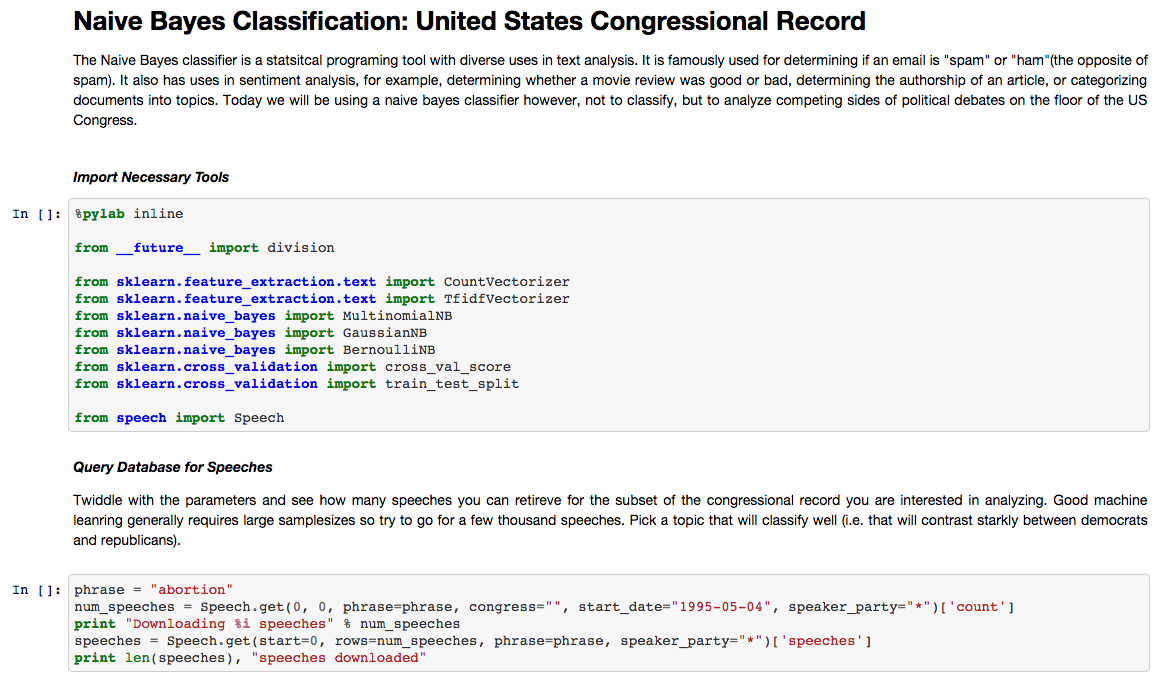
The last technique we talked about was classification (example). Classification at a high level is a type of supervised learning where one starts with an initial labeled set of data, the training set, and tries to classify novel pieces of data into one of the known labels. For natural language data, one of the most common classifiers to use is a naive bayes classifier. A naive bayes classifier is built on top of Bayes Rule, a formula for calculating conditional probability, P(A|B) = ( P(B|A) * P(A) ) / P(B). Conditional probability is very important for the naive bayes classifier as we are essentially finding the probability of the words of a document appearing in a corpus, given that we know the document has a label. To elaborate, naive bayes calculates the conditional probability for each word in the corpus to fall into each label (class). For the probability that a document will fall into a class, we multiply the probability of all of its words and determine the label with the greatest probability.
Now you may be thinking, how can you just multiply the probabilities just a few lines after literally defining a rule for conditional probability. For example, there is a good chance you’ll find “the” at the beginning of a sentence, a verb near the end, a conjunction perhaps somewhere in the middle, and adjectives before nouns, etc.. The order of the words should have an impact on its probability both in the corpus and within a class! Although this is true, natural language processing and more specifically naive bayes often uses the “bag of words” assumption. This is where the “naive” part comes in to naive bayes. We assume that each word is independent of the others and order does not matter in order to simplify our calculations and speed up the algorithm. Although this is technically “wrong”, we find that in practice this works well enough for most situations.
One use case of classification that I prepared an exercise for is using classifiers to find insights about different groups of data. After training a classifier you can see which words are most likely to identify one label from another. This is very different from finding the words most representative of each label; naive bayes will give you words that highlight the differences between them. Try this out on the congressional record here.
Classification has a wide variety of use cases in journalism. It can also be used for extracting addresses from strings or even standardizing campaign donors.
The Process
After talking about the various tools of the trade, people had many practical concerns about how to actually go about the process of an NLP project. We talked about how wrangling the data is often one of the most time consuming parts, especially when dealing with government data. In addition, we talked about the importance of using a database built for text indexing and searching. When exploring your dataset, you often want to find all documents only pertaining to a certain topic sorted by relevance. This is exactly what such databases can enable you to do. I’ve used Apache Solr and Elasticsearch in the past. If you’re not ready to make the jump to a NoSQL database, Postgresql also has full text search capabilities. Last but not least, we talked about the importance of actually reading and looking through your own data. Changing out one algorithm for another in attempts to improve performance or find different insights can be a futile game; algorithms are a dime a dozen and generally don’t help as much as truly reading and understanding your data to gain subject matter expertise. For example, you may find that you need to come up with your own list of “stop words” for a given dataset in order to fine tune the results.
The Future
Ask anyone in the field and they’ll have a different answer to the “future of NLP”. Since the 80’s when the beginnings of NLP were first developed people thought of it as the panacea to all of the world’s problems - the single roadblock in the way of achieving the first sentient AI. We talked a bit about some of the amazing technologies we now have in the world of NLP. One recurring example was Narrative Science from our own Northwestern University. Narrative Science developed a natural language generation technology for turning “data into stories”, as their slogan says. Another example we used was IBM Watson, a “cognitive computing system” that’s most popularly known for being the first computer system to beating the jeopardy champions about 3 years ago. Its remarkable technology has the ability to parse unstructured natural language in the form of questions and pull from a huge database of information to answer them in record time. As journalists, NLP based projects, such as our own political framing project, we hope will increasingly help us uncover stories and truths in large text datasets that might otherwise go unnoticed.


