This year's CAR conference has had many discussions about organizing data and surfacing stories, whether it’s through crowdsourcing personal stories in Al Jazeera’s “Uganda Speaks” project or by analyzing 80,000 censored Weibo posts in ProPublica’s “China’s Memory Hole.” Social network analysis, which is the analysis of the connections linking people, businesses and organizations, provides opportunities to uncover critical, and otherwise unknown, connections among such entities.
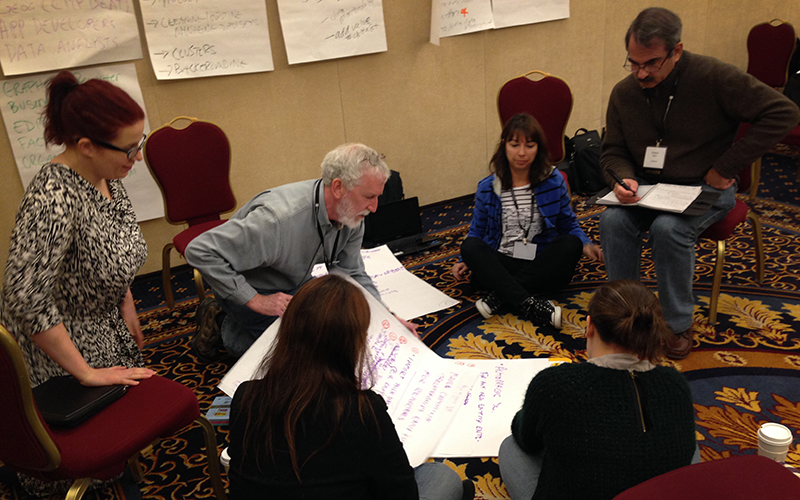
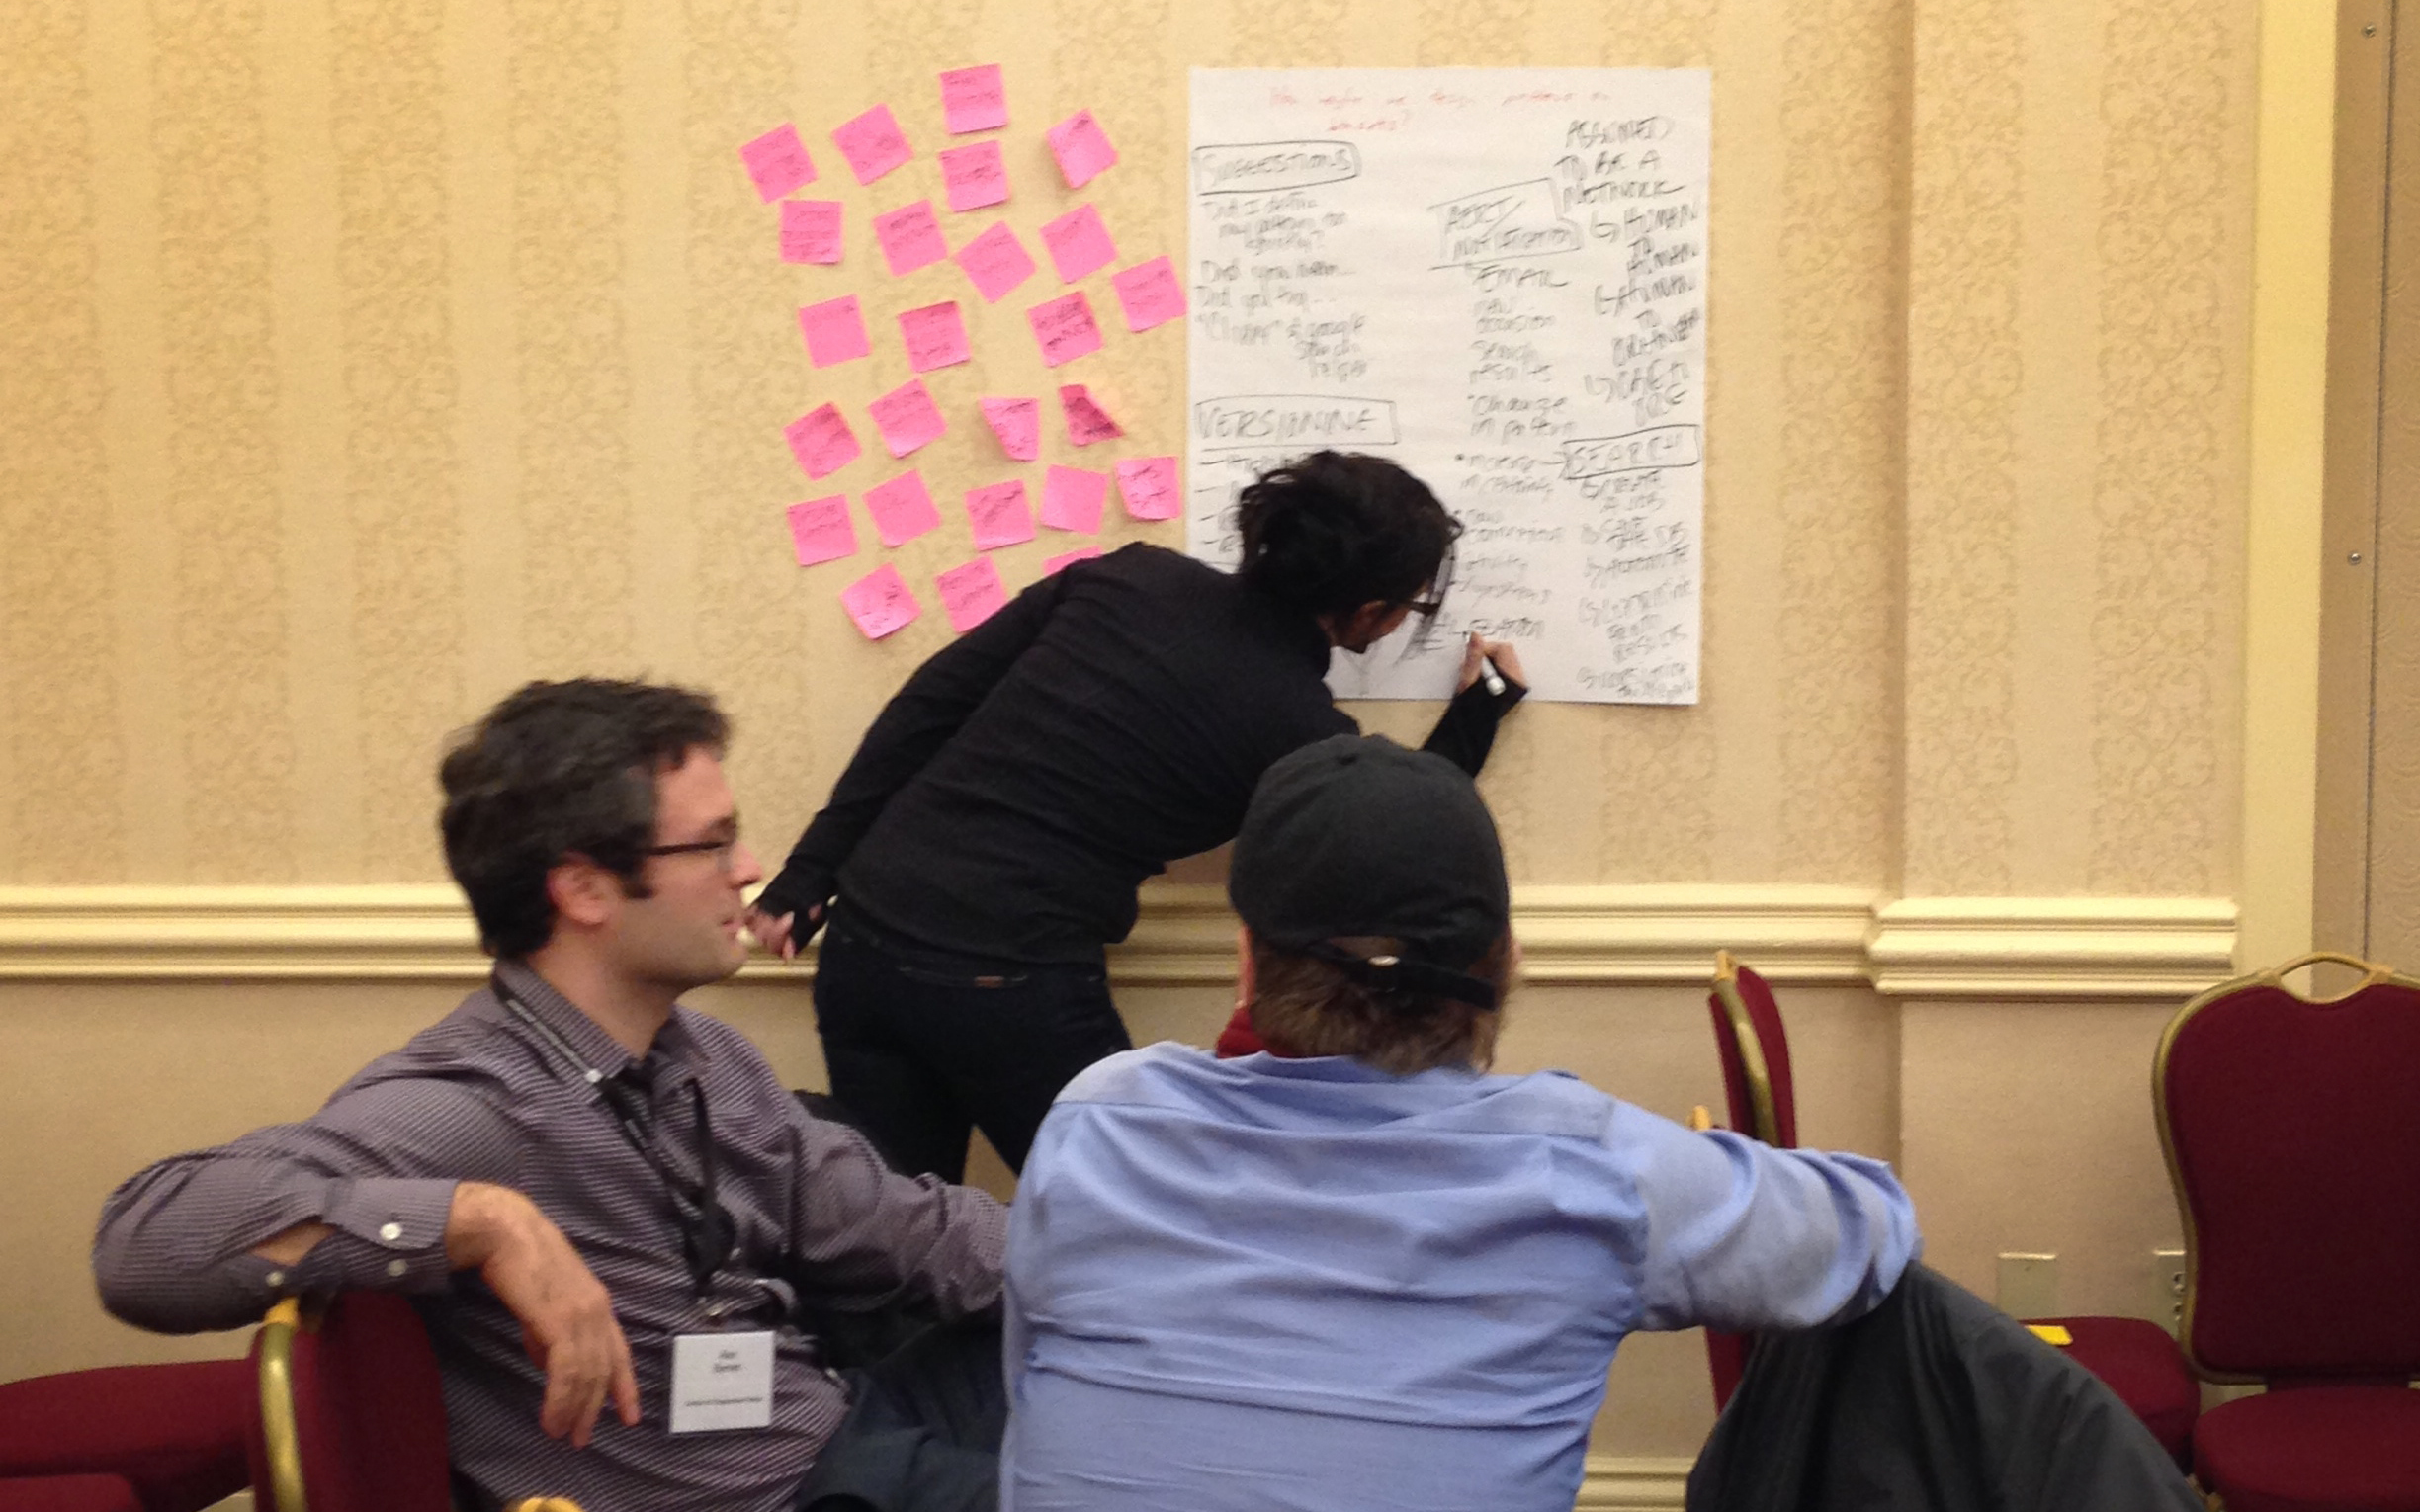
For a while now, the Lab has been working through a series of research projects under a larger effort called Untangled, ideas for social network analysis investigation and journalism. As we’ve previously reported, Untangled aims to provide journalists with a way of systematic research and documentation of noteworthy connections when reporting on a complex topic. Sunday morning, Rich Gordon, Miranda Mulligan and Joe Germuska facilitated a workshop to design new tools and technological approaches for social network analysis investigation.
“The stories of our time are network stories,” Gordon said at the start of the workshop, citing “Bridgegate” as an example. “But we’ve hardly seen any network analysis.” Network analysis allows journalists to understand influences and relationships from network datasets, helping them to “discover things they never could have found otherwise.”
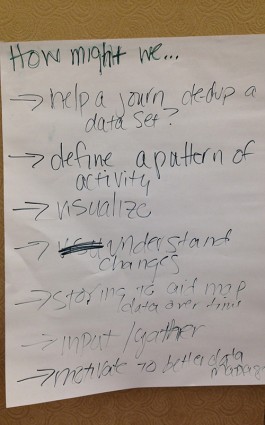
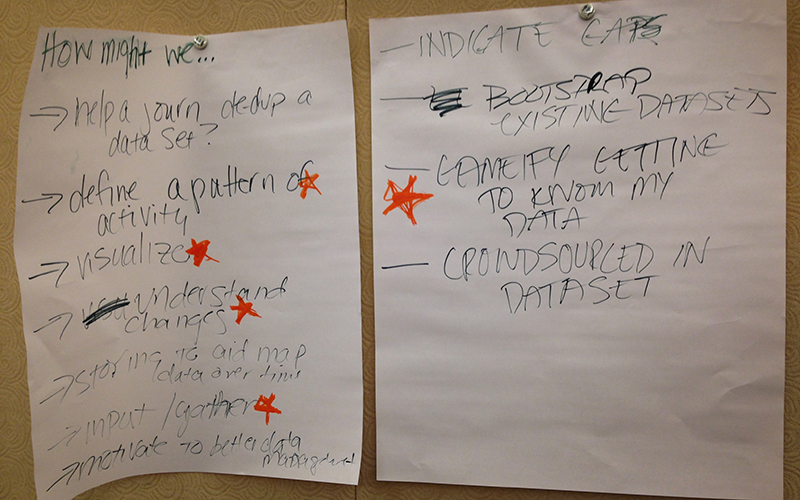
The groups primarily focused on potential tools that would help reporters gather, understand and visualize patterns and data. Teams pursued design questions that sought to visualize internal and external relationships in networks, gameify data input and processing and define patterns of activity in datasets.
The following are three technology ideas for making it easier to practice social network analysis in our investigations and journalism:
1. A relationship ecosystem monitor for journalists
 Team: Rich Gordon, Momi Peralta Ramos, Mar Cabra, Gabriela Bouret, Ricardo Brom and Jacqui Maher
Although social network analysis can play an important role in uncovering potential stories, capturing information about those relationships can be cumbersome and may not be part of a typical workflow. The group emphasized that in order to prompt journalists to use the tool, the system must be easy to import bulk data, view that data once in the system, search the data and add to the data. On the technical side, they reported that quantifying strengths of relationships within social networks and storing metadata for relationships would help further analyze and collect the data for future investigations. To encourage and incentivize newsroom participation, the tool would also have to track data contributions and produce metrics.
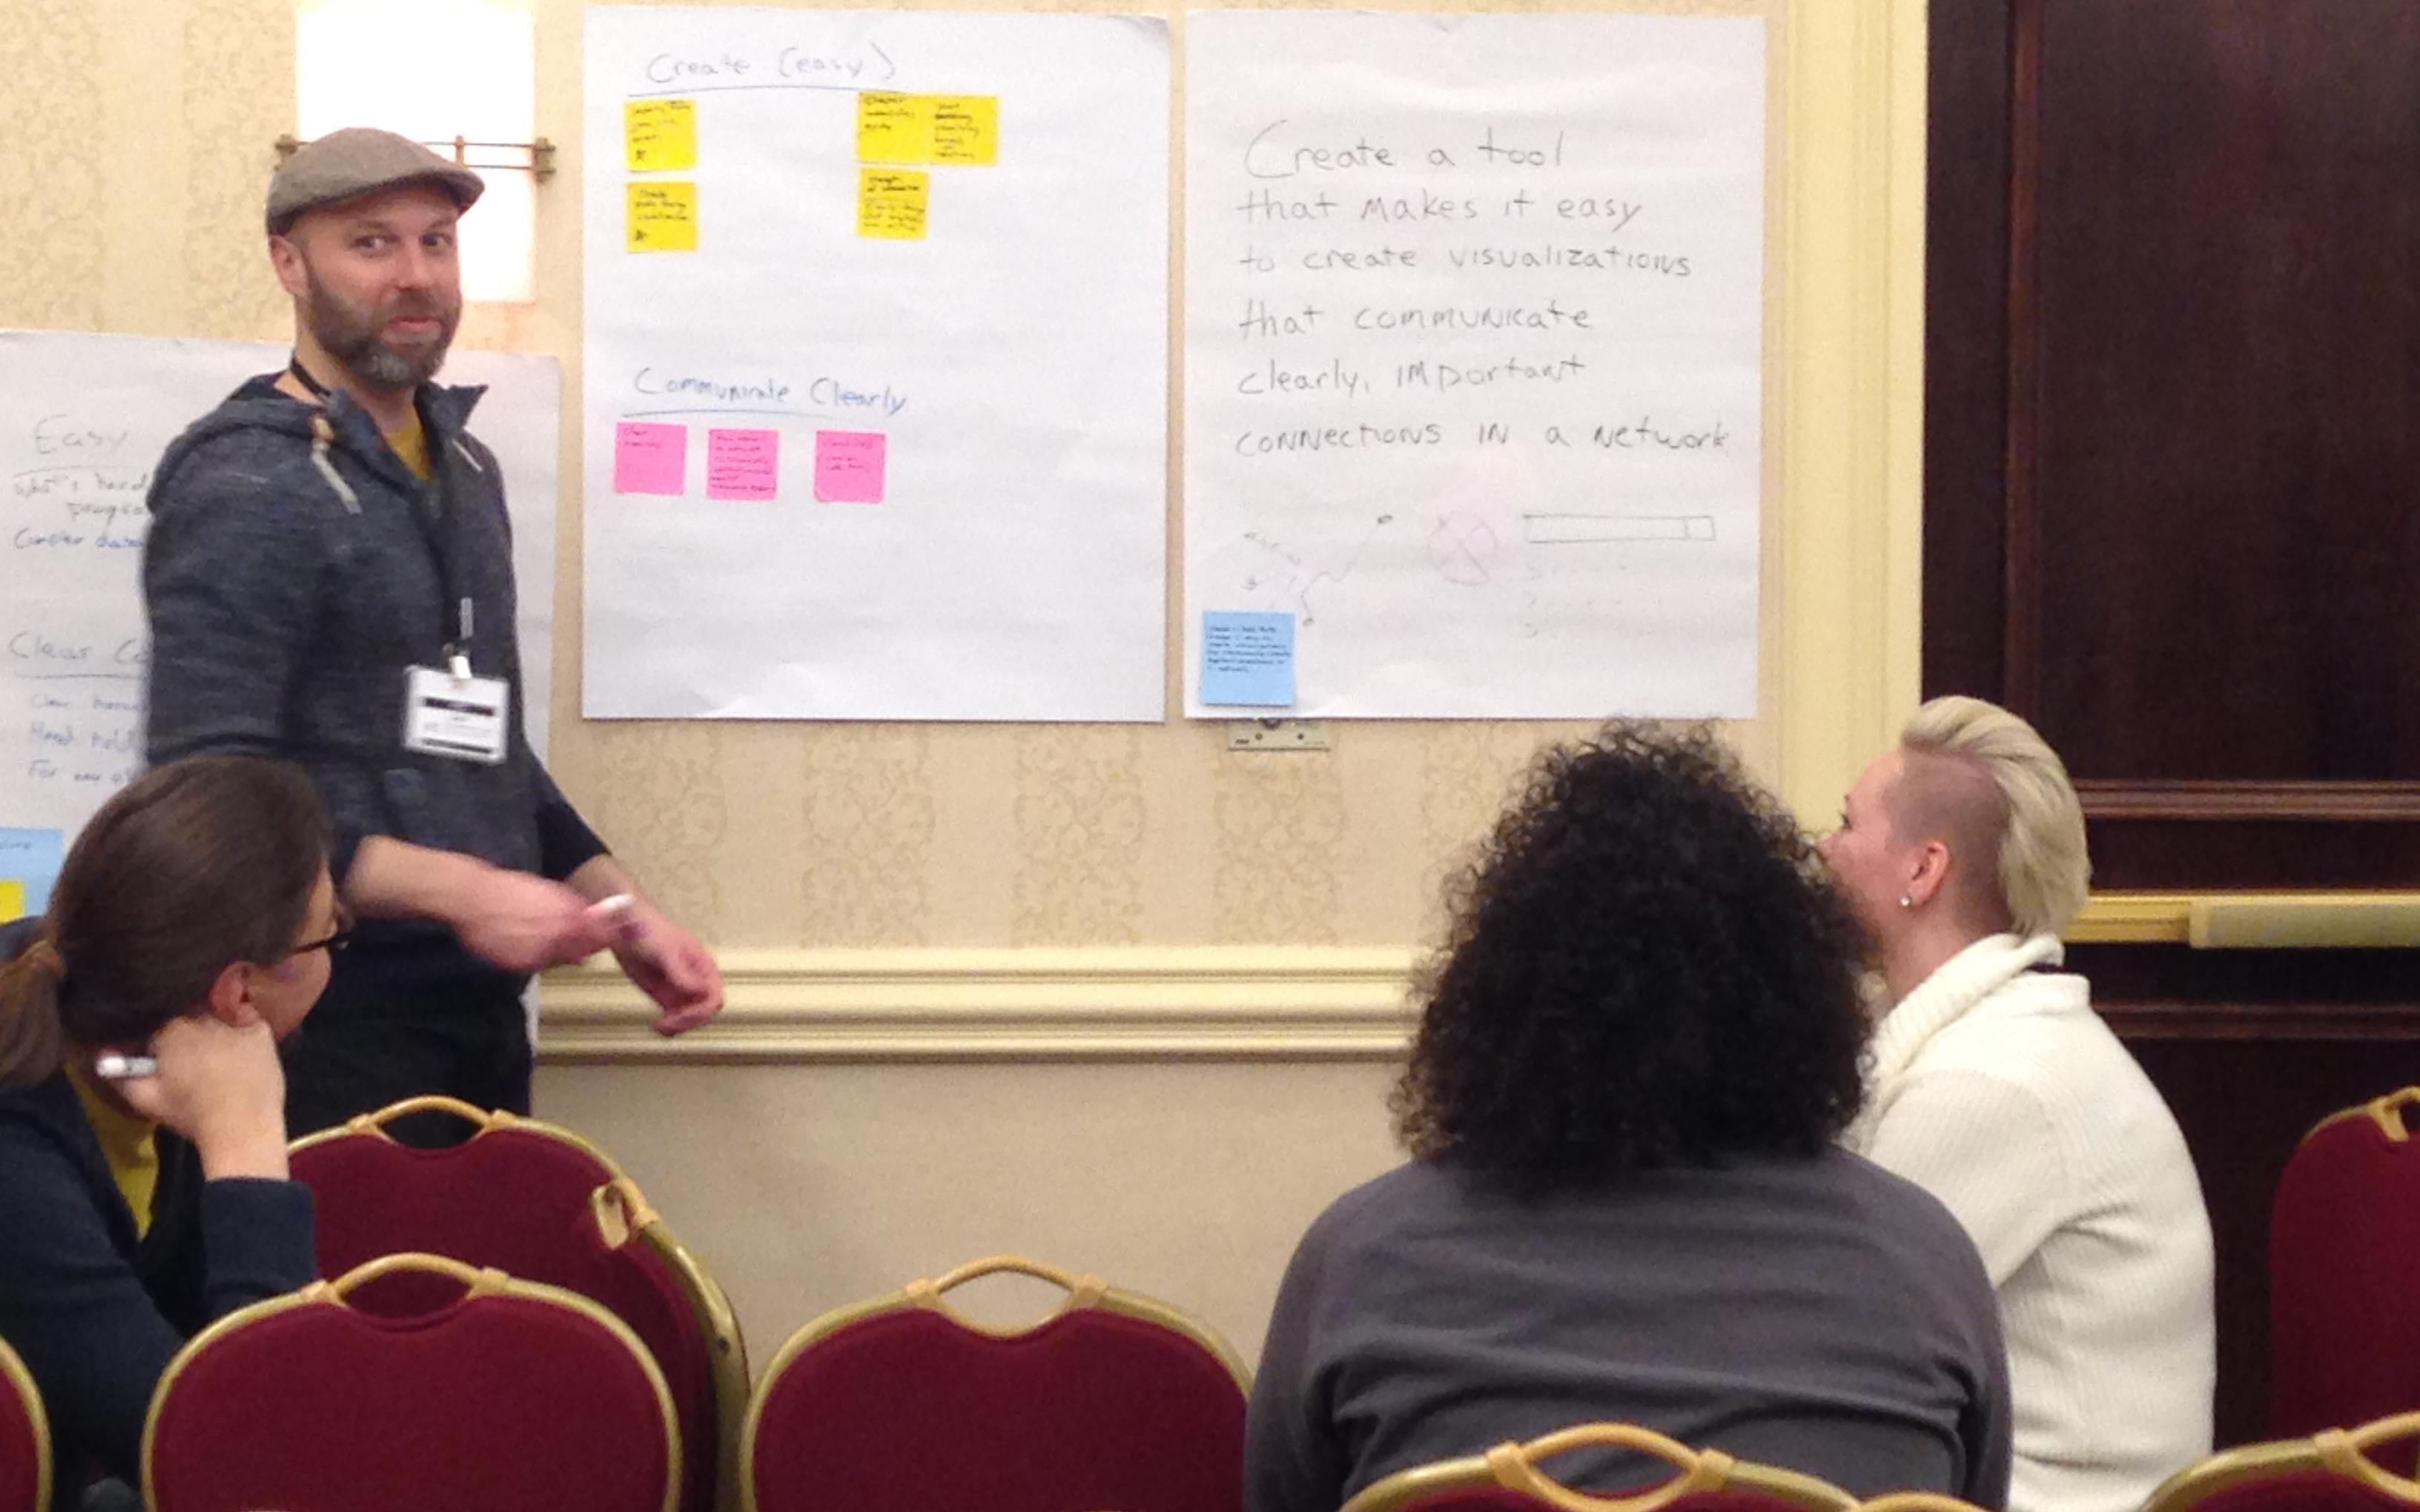
2. A tool that creates visualizations of important connections in a network
 Team: Zach Wise, Kurt Jansson, Magnus Bjerg and Liv Håker
Network visualizations are hard to make and difficult to understand. The group’s solution was to create a tool that makes it easy for journalists to create visualizations that communicate clearly, important connections in a network. The tool would have users import different types of data (JSON, CSV, Excel) and allow them to identify which entity’s (individuals, companies, organizations) perspective to observe. The goal was enabling data exploration and discovery in the authoring process by looking at networks from different angles. A fully featured system would create public facing visualizations based on the relations while demonstrating a clear hierarchy in the data. Additional features could guide journalists through the network analysis and contextualize elements and their relevance.
3. Better understanding and recognizing patterns in datasets
 Team: Miranda Mulligan, Alexander Cohen and Alex Byrnes
The group began designing a system to better understand and recognize patterns in datasets. They felt the system would need to have robust search features, alerts or notifications via email, suggestions for further exploration and visualizations of those patterns discovered in the data. They envisioned it as an open source tool that would be designed to work with known sources. The search feature would allow users to create or save a job, automate a job on a timeline and learn from previous search jobs. They felt it would be useful to include versioning in the search.
Every year New York Times' Chrys Wu curates 'Slides, Links & Tutorials' from the annual CAR conference: 2014, 2013, 2012 and 2011. They are a fantastic resource for all journalists and investigators of all skill levels.
About the author